Business Metrics with CloudWatch EMF and Lambda

Any good business runs with goals and key performance indicators (KPIs) that are monitored and managed. These can be user signups, subscription sale trends, or customer churn. Any cloud-born or cloud-native business is no exception to this.
This post provides a how-to guide for creating business metrics using Amazon CloudWatch and AWS Lambda services.
Introduction
Amazon CloudWatch helps you observe and monitor AWS resources and applications in the cloud and on premises.
AWS Lambda is a serverless, event-driven compute service that lets you run code for any type of application or backend service without provisioning or managing servers.
Any AWS service publishes metrics in Amazon CloudWatch. You can also publish your own application-specific custom metrics — things like the number of third-party API calls, count of status codes returned by an API, user signups, or average order values. Based on these metrics, you can build dashboards or configure alert notifications.
Ways to Add Amazon CloudWatch Custom Metrics
PutMetricData API
Amazon CloudWatch provides an API through which you can put custom metrics directly. But sending the API request is a synchronous process. For high-volume applications, you have to batch up requests to avoid throttling. CloudWatch API usage for custom metrics also incurs cost.
Metric Log Filters
Metric log filters can search and filter data points from CloudWatch log groups to create metrics. It’s a better option than the API since it’s asynchronous. The drawback: every time you need a new metric, you must create a new metric log filter.
EMF (Embedded Metric Format) for CloudWatch
The third option is using Amazon CloudWatch’s Embedded Metric Format (EMF). It’s also asynchronous, but with EMF:
- No additional charges for the customer
- No prerequisites like pre-creating log filters
- Many customers have enjoyed up to 65% cost reduction compared to the PutMetricData approach
Implementation
This walkthrough assumes familiarity with AWS Lambda and Amazon CloudWatch, and that you can deploy a Lambda function in your own AWS account.
The implementation uses AWS Lambda and Amazon CloudWatch, but you can use the EMF format with any AWS compute service — Amazon ECS, Amazon EKS, or AWS Fargate.
Let’s create an AWS Lambda function to log custom metrics. In our example, the Lambda function orderservice represents a fictitious order service where we track the average order value trend.
Step 1: Create the project directory
mkdir orderservice && cd orderservice && npm init -yStep 2: Install the aws-embedded-metrics library
npm install aws-embedded-metricsThis creates a node_modules directory with the required dependencies. The aws-embedded-metrics library handles logging custom metrics in CloudWatch EMF format.
Step 3: Create index.js
const { metricScope } = require('aws-embedded-metrics');

const orderMetrics = metricScope(metrics => async event => {
  // Define the namespace for custom metrics
  metrics.setNamespace('OrderManagement');

  // Set dimensions
  metrics.putDimensions({ Service: 'OrderService', CustomerId: '26102022' });

  // Write the metric value to CloudWatch
  metrics.putMetric('Avg. Order Value', Math.floor(Math.random() * 100), 'None');

  // Add context as properties for CloudWatch Log Insights queries
  metrics.setProperty('AccountId', '123456789012');
  metrics.setProperty('RequestId', '45b7d3b0-ca99-44a2-93ad-05e29c9d40e6');
  metrics.setProperty('OrderId', '7b125931-7898-4eab-bf16-78b8dc87707d');
  metrics.setProperty('Payload', {
    sampleTime: new Date(),
    customerId: 26102022,
  });
});

exports.handler = orderMetrics;
Note:
putMetricuses a randomly generated value here for demo purposes. Replace it with your actual metric value.
Step 4: Package and upload
Compress all files and upload to Lambda:
zip -r ../orderservice.zip .Upload orderservice.zip to your Lambda function via the AWS Console.
Step 5: Test and verify
After uploading, test the Lambda with a test event. To simulate real-world traffic, invoke the Lambda function multiple times using the console’s Test feature.
After a few seconds, you’ll see the OrderManagement custom metric appear under CloudWatch → Metrics.
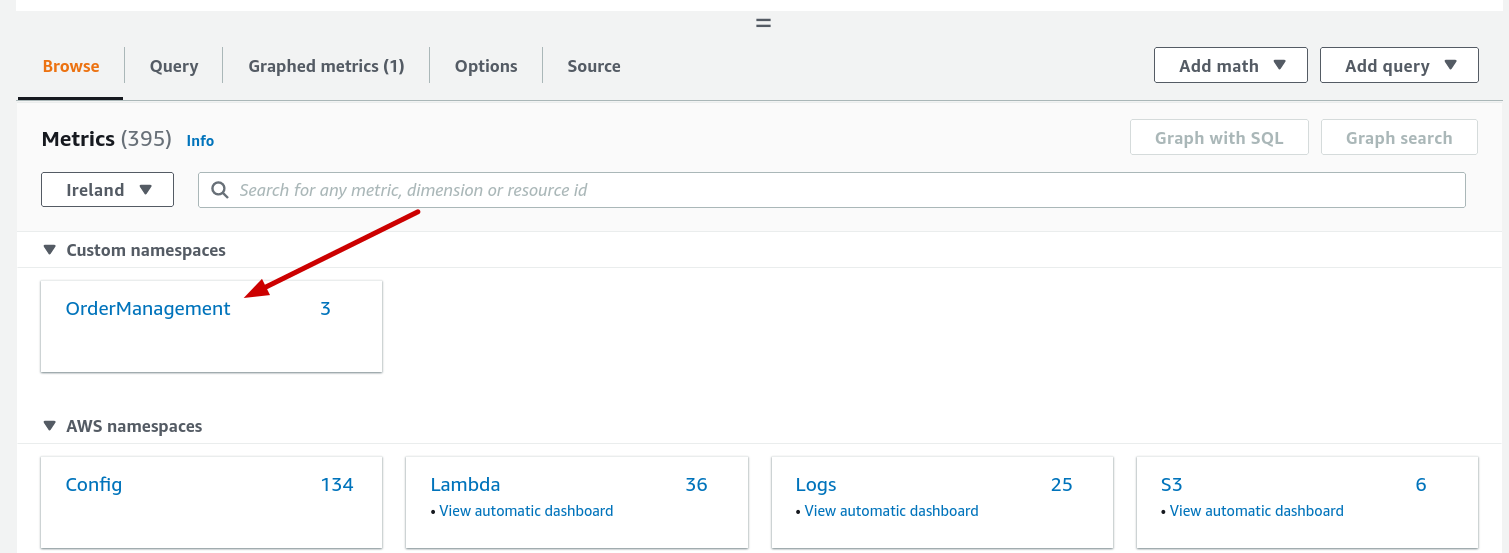
Clicking on the OrderManagement metric, you can see CustomerId, Service, ServiceType and ServiceName dimensions. After small touch ups on the graph, the final output of custom metric looks as below.
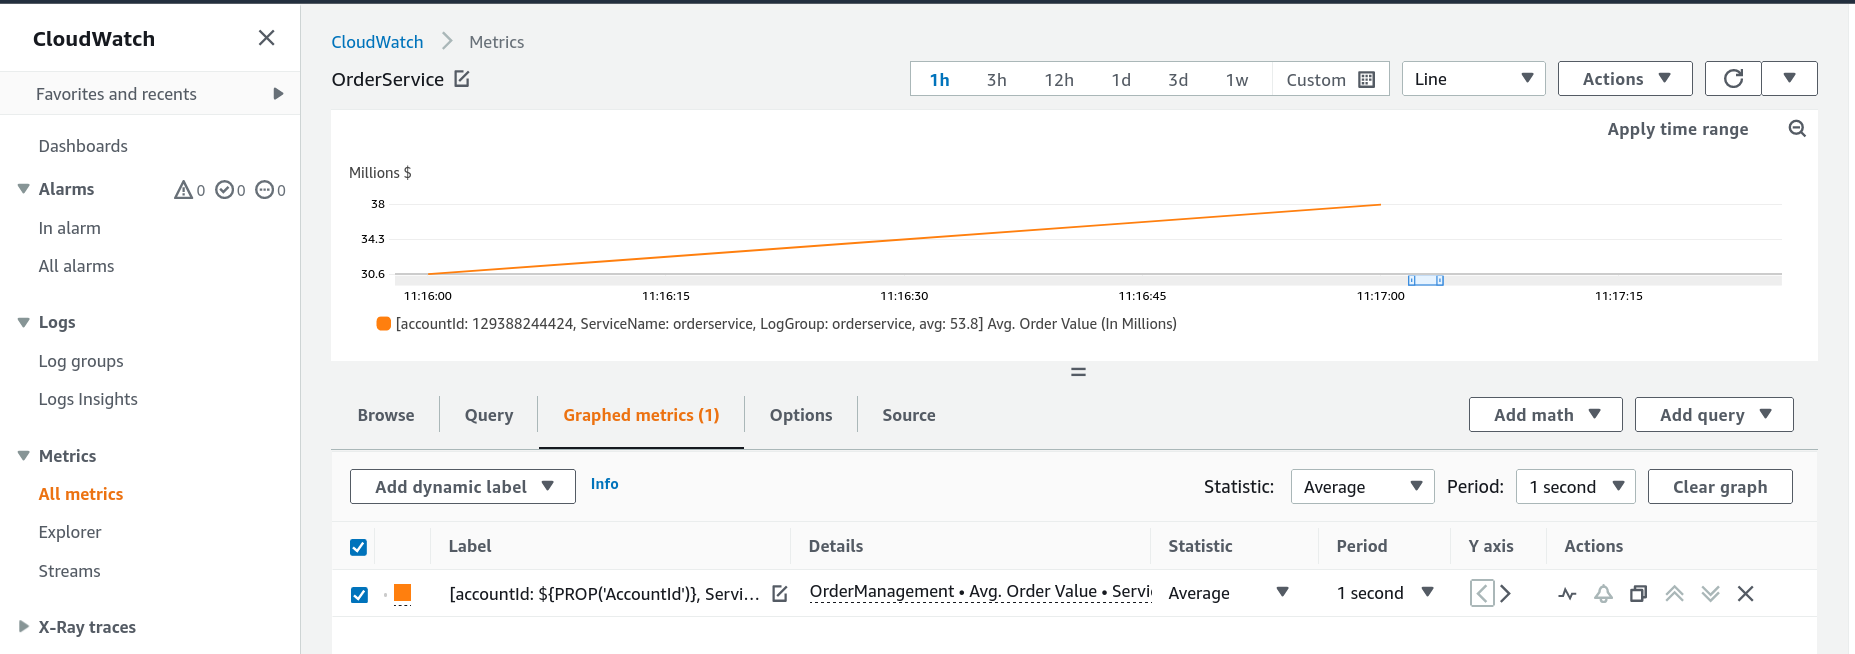
From there you can:
- Build dashboards tracking
Avg. Order Valueover time - Set CloudWatch alarms — for example, alert when an order exceeds USD 50 million
- Use CloudWatch Log Insights with the properties set via
setProperty
Summary
EMF format for Amazon CloudWatch is a great feature for creating custom business metrics. It’s asynchronous, has no extra cost, and requires no upfront configuration of log filters. Combined with AWS Lambda, it’s one of the most cost-effective ways to instrument business KPIs directly from your application code.
Now go build!