SonarQube: A Code Quality Platform for Teams

Code reviews are invaluable, but they don’t scale. In a distributed team with varying levels of experience, the quality bar shifts with whoever is reviewing that week. What we actually need is a way to make quality standards visible, measurable, and consistent—independent of who happens to be paying attention.
SonarQube is an open-source platform for continuous code inspection, and after evaluating several tools, it became our go-to recommendation for teams serious about technical health. What follows is a walkthrough of installing and configuring SonarQube 5.0.1 for a C# project on Windows, integrating it with FxCop, StyleCop, and OpenCover to get a comprehensive quality picture.
Prerequisites
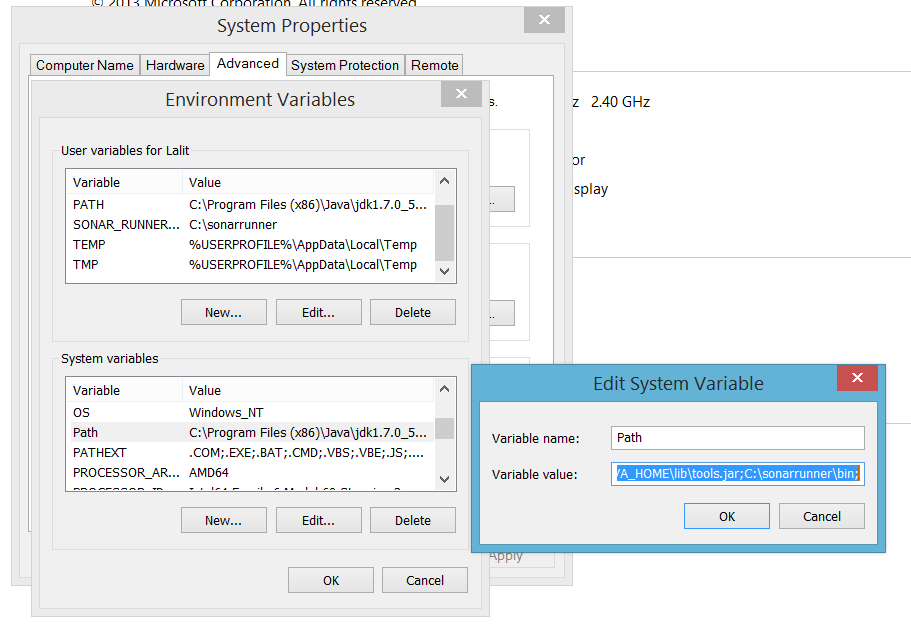
You need Java JDK 1.7 installed on the machine that will run SonarQube. Set the JAVA_HOME environment variable and add the JDK bin directory to your system PATH.
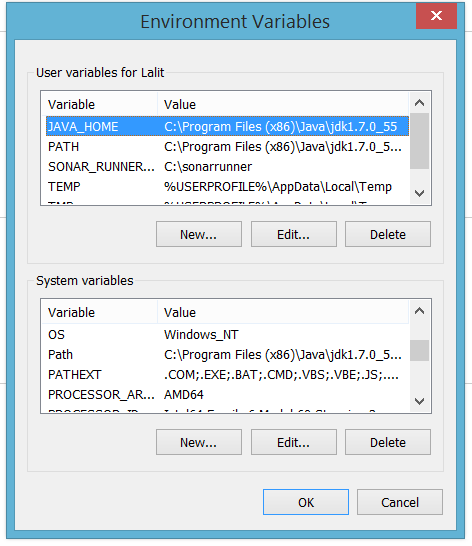
Once the environment variables are set, open a new command prompt and verify:
java -versionYou should see the Java version without errors.
Required downloads
| Tool | Version |
|---|---|
| FxCop | 10 |
| StyleCop | 4.7.49.0 |
| OpenCover | 4.5.3522 |
| SonarQube | 5.0.1 |
| Sonar Runner | 2.4 |
FxCop and StyleCop handle static analysis of C# code—design violations and style violations respectively. OpenCover measures test code coverage. SonarQube is the analysis platform itself, and Sonar Runner is the command-line tool that triggers analysis and uploads results to the server.
Installation
Extract SonarQube and Sonar Runner to directories with no spaces in their paths. Spaces cause subtle failures in the runner scripts that are annoying to diagnose. Simple paths work best:
C:\sonarqube\
C:\sonar-runner\
Add the Sonar Runner bin directory to your system PATH so you can invoke sonar-runner from any working directory.
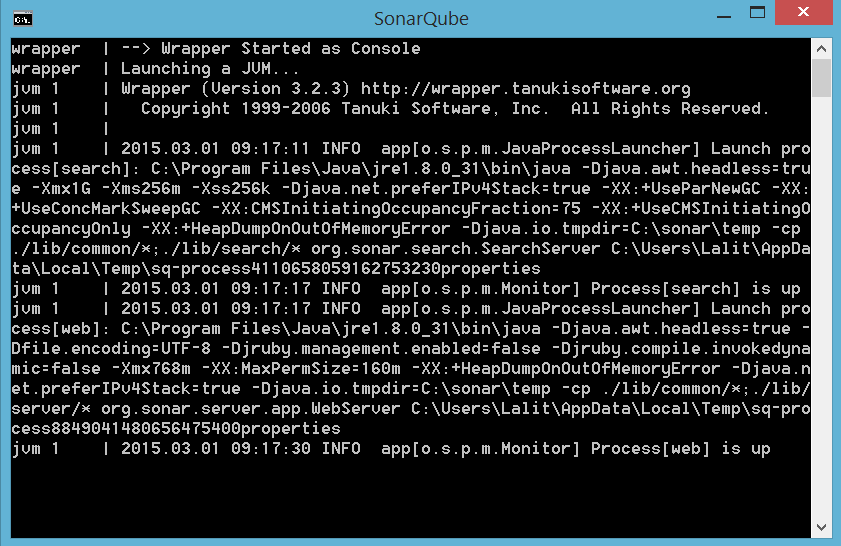
Starting the SonarQube server
Navigate to C:\sonarqube\bin\windows-x86-64\ (or the 32-bit equivalent) and run StartSonar.bat. Once the server starts, open your browser to http://localhost:9000. You should see the SonarQube dashboard.
The default credentials are admin / admin. Change them immediately in any shared or production environment.
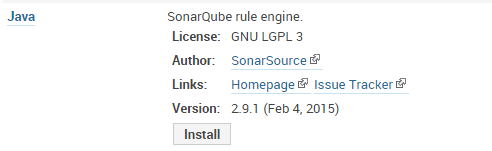
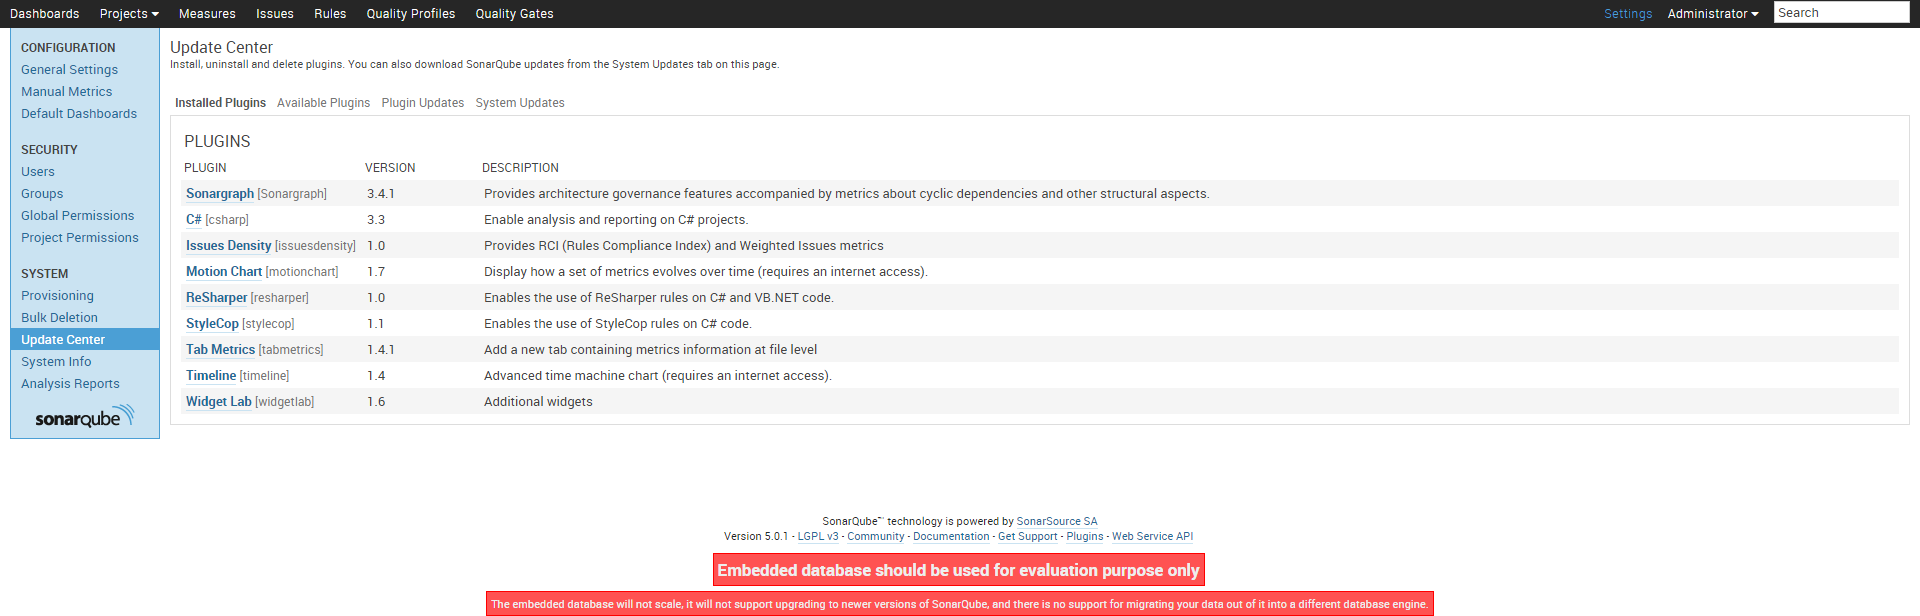
Configuring the C# plugin
SonarQube’s C# analysis relies on FxCop, StyleCop, and OpenCover. Navigate to Settings → General Settings → C# and map the paths to each tool’s executable:
With paths configured, the C# plugin knows where to find each analyzer at inspection time.
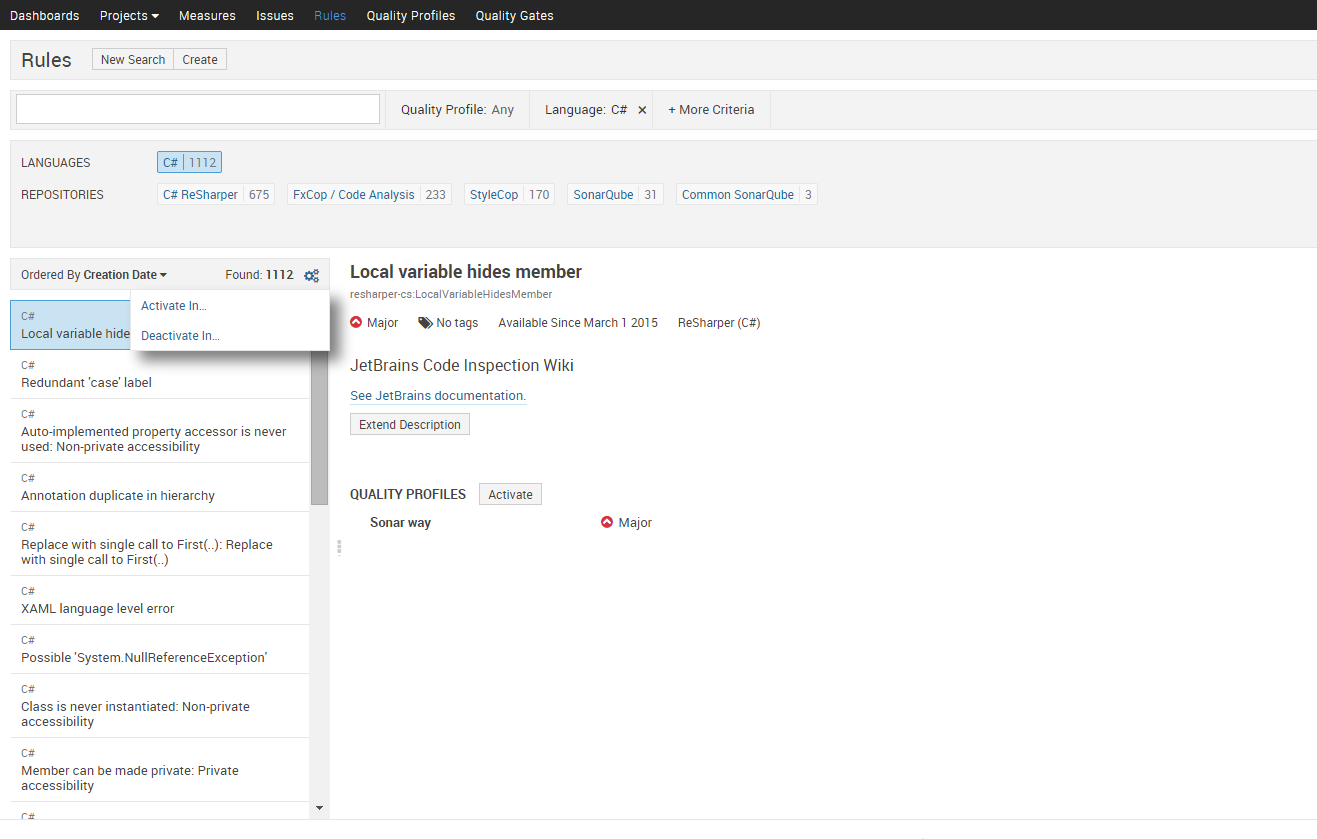
Setting up a quality profile
Quality profiles define which rules are active and at what severity. SonarQube ships with a default profile, but you’ll likely want to customise it for your team’s standards. Navigate to Quality Profiles and either extend the default or create one from scratch. When activating rules from FxCop and StyleCop, focus on rules that catch real bugs and maintainability problems—not purely cosmetic ones. A bloated profile full of low-signal warnings trains people to ignore the dashboard.
Running your first analysis
In the root of your project, create a sonar-project.properties file:
sonar.projectKey=MyProject
sonar.projectName=My Project
sonar.projectVersion=1.0
sonar.sources=.
sonar.language=cs
sonar.dotnet.visualstudio.solution.file=MyProject.sln
Then run:
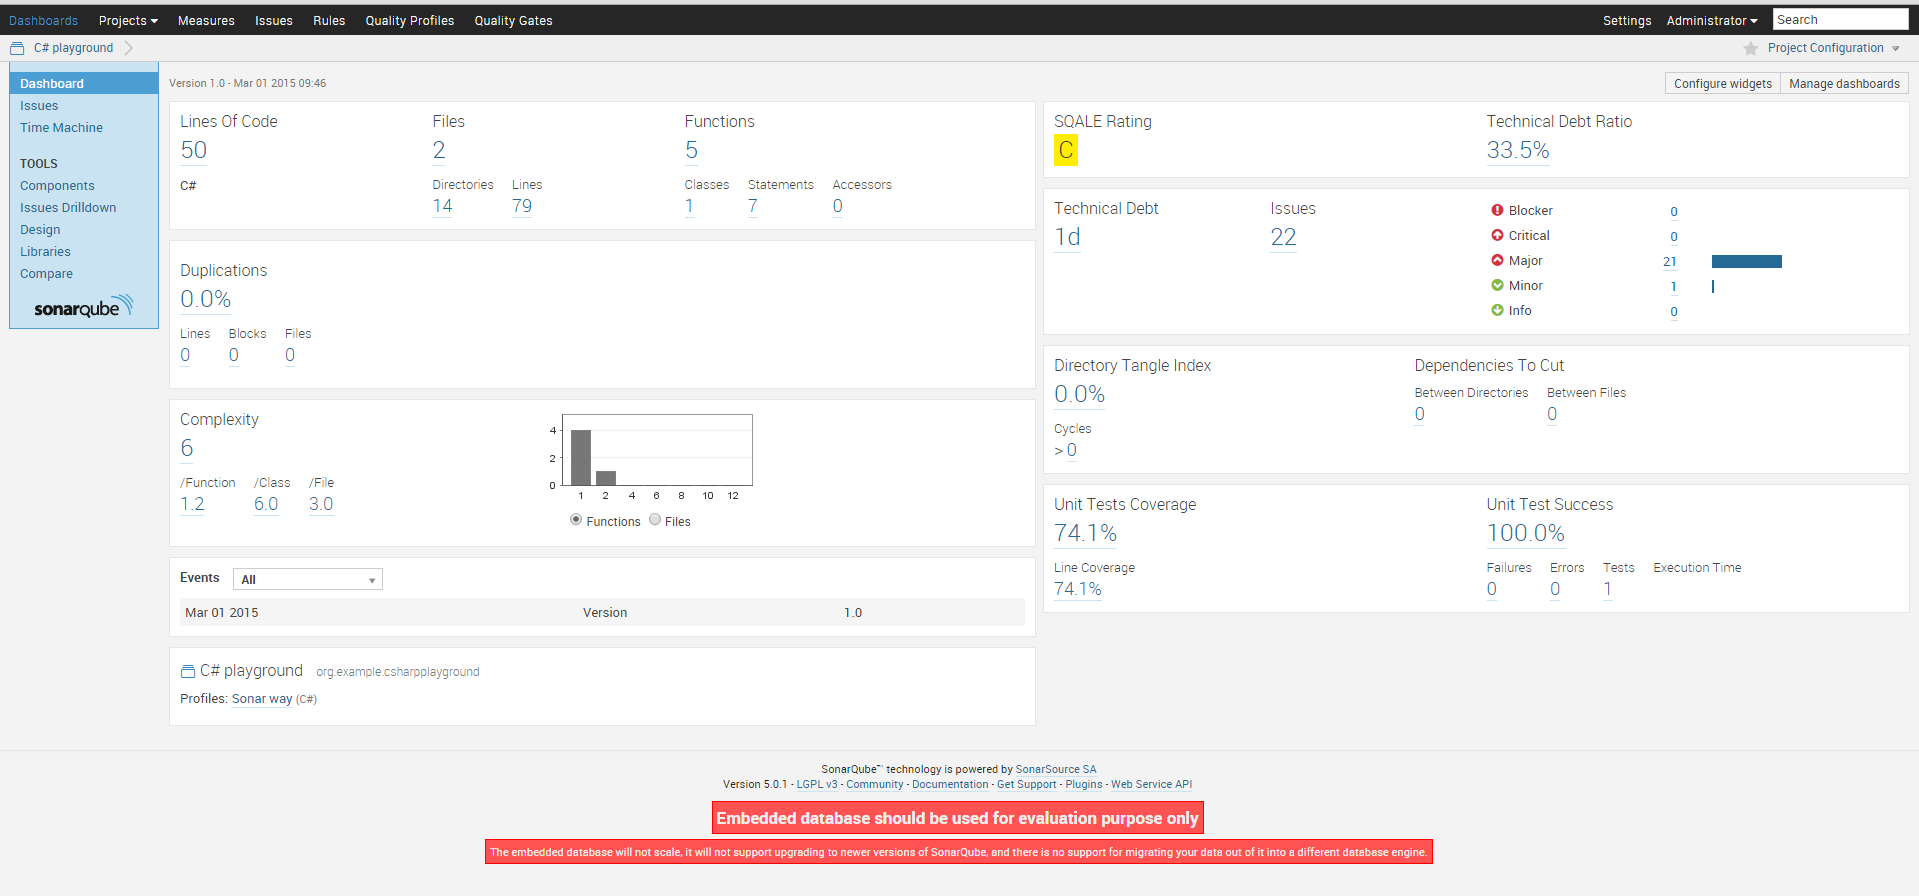
sonar-runnerThe runner reads this configuration, executes the analysis tools, and uploads results to the SonarQube server. Once it finishes, return to the dashboard to see your project’s quality metrics.
After drilling into violations and reviewing the results, the final dashboard gives you a clear picture of where the code stands:
What the numbers actually mean
SonarQube’s metrics give you one important perspective on quality—not the whole picture. The temptation, especially when leadership discovers the dashboard, is to treat the score as the goal. That’s where the value breaks down. A green Sonar dashboard tells you the code passes the rules you’ve activated. It says nothing about whether those rules are the right ones, whether the architecture is sound, or whether the system does what users need.
Use the metrics to start conversations, surface trends, and prioritise refactoring. The question worth asking isn’t “how do we improve the score?” It’s “what does this violation tell us about how we’re working?” Those are different questions, and the second one is harder.